

In today’s data-driven world, many industries are navigating vast amounts of data, much of which comes without clear labels or categories. This is where unsupervised learning steps in, providing the tools to uncover patterns, make sense of the unknown, and reveal hidden insights. Imagine exploring a vast, uncharted territory with no map, no guide, and no clear destination. Yet, as you venture deeper, patterns begin to emerge, and you discover landmarks and hidden treasures along the way. This is the essence of unsupervised learning—finding structure within data without explicit guidance.

Unlike supervised learning, where models are trained with labeled data, unsupervised learning works without predefined categories or target variables. It’s like wandering through a new city without knowing the names of the streets or landmarks—no prior information is provided, yet over time, you start to uncover meaningful relationships.
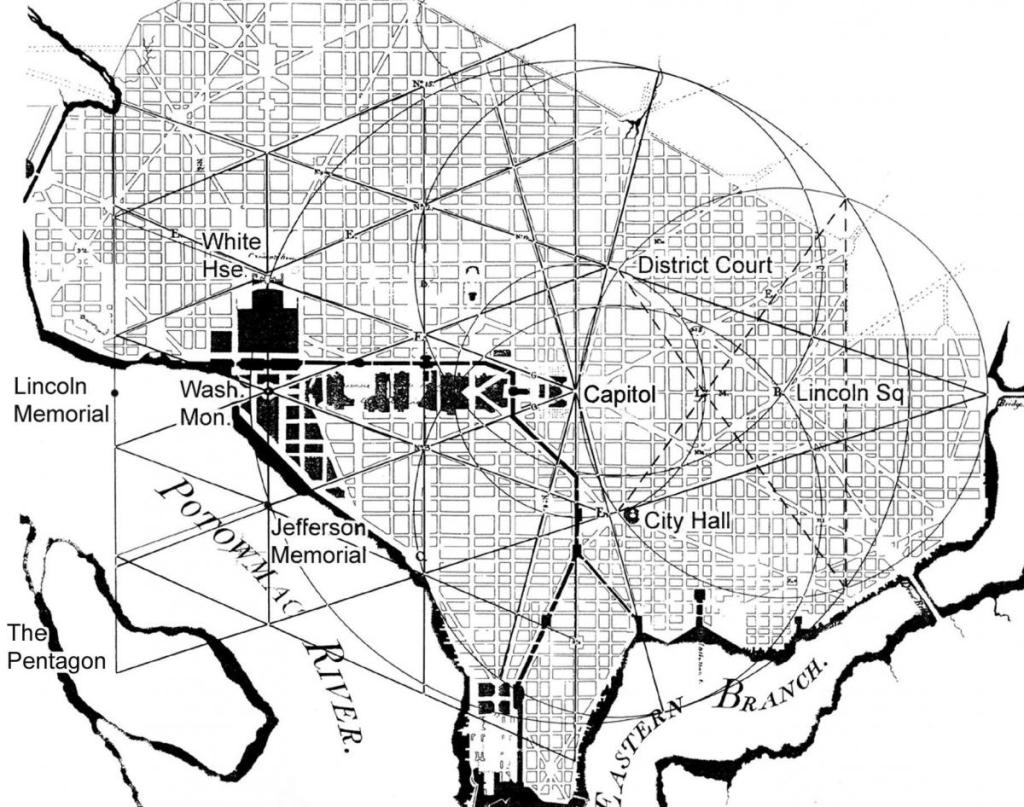
Quick side tangent on cities. I’ve lived in DC for almost a decade and if you’ve ever visited or lived in Washington D.C. then you would know it is perhaps the best designed city, at least in my opinion. Designed by Pierre L’Enfant, a Parisian architect, the entire city was built around the idea that every citizen was equally important. At the center was the U.S. Capitol, and all streets radiate from that central point, along with easily named and numbered streets and avenues (A, B, C, and 1, 2, 3) anchored by roundabout squares. Once you recognize this pattern, you quickly realize how easy and wonderful it is to navigate around the district.
Clustering: Organizing Data Like a Bookshelf
I love the design and architecture of DC but back to unsupervised learning. Now, clustering algorithms are one of the foundational tools in unsupervised learning, and they work similarly to organizing a bookshelf. Just as you would sort books by genre, author, or subject unless you don’t care to, clustering, groups similar data points based on shared features, helping to create structure within vast datasets.
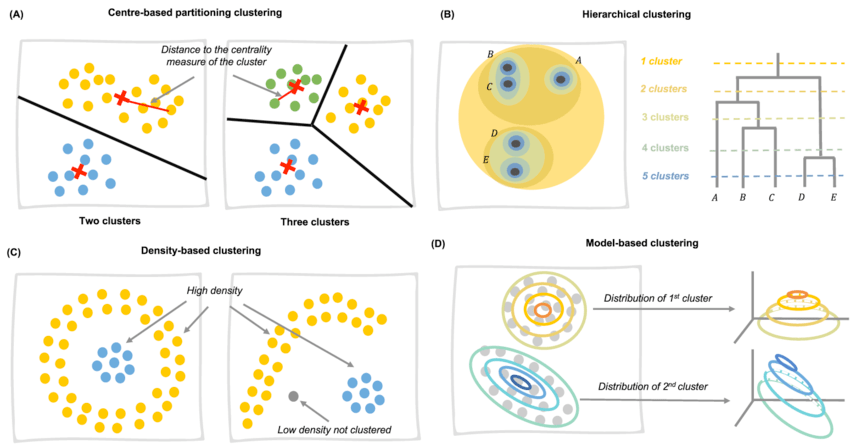
Popular clustering algorithms include:
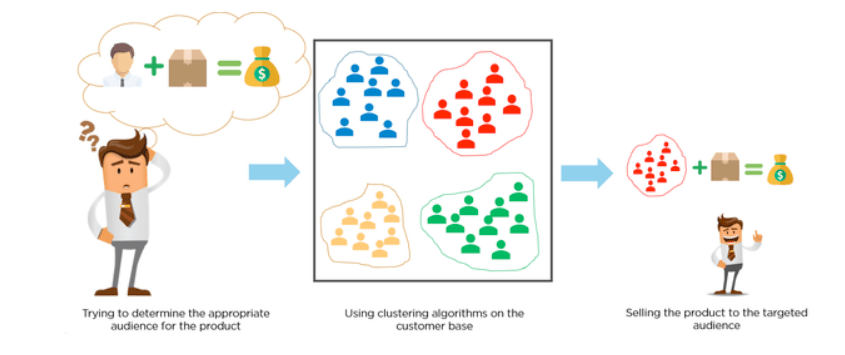
- K-means clustering: This algorithm partitions data into K distinct clusters by grouping points based on similarity to the cluster’s centroid (mean). It’s frequently used in customer segmentation, such as Netflix’s recommendation system, which groups users based on viewing habits, or in Spotify’s playlist generation to recommend songs based on similar listening patterns.
- Hierarchical clustering: Unlike K-means, hierarchical clustering builds a tree-like structure of nested clusters, allowing for a more detailed exploration of relationships. It’s ideal for understanding gene expression data or mapping out social networks where relationships between clusters need to be visualized.
- DBSCAN (Density-Based Spatial Clustering of Applications with Noise): DBSCAN groups data points based on density and is particularly effective when dealing with irregularly shaped data or when detecting outliers—for example, identifying distinct customer segments in retail sales or spotting anomalies in geographic data.
By applying clustering techniques, you can explore your data without predefined labels, uncovering hidden groupings that would have been otherwise overlooked.
Dimensionality Reduction: Simplifying Complex Maps
Often in data science, we work with high-dimensional datasets that contain many features—some of which are not relevant. Dimensionality reduction simplifies this complexity by focusing on the most important features while ignoring the rest. It’s akin to simplifying a complex map, where unnecessary details are removed, and only key landmarks are highlighted for easier navigation.
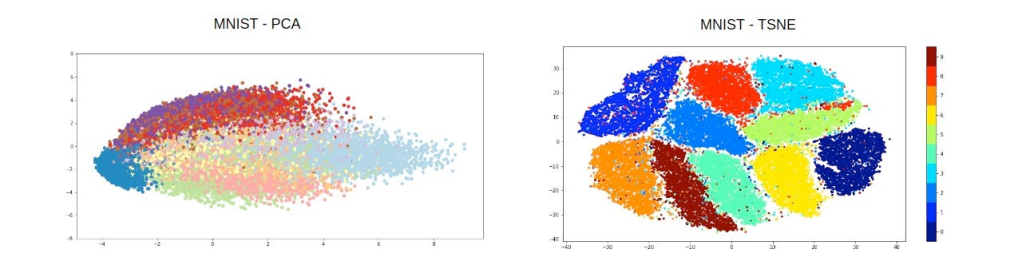
Two widely used techniques for dimensionality reduction are:
- Principal Component Analysis (PCA): PCA reduces the dimensionality of a dataset by transforming it into a set of principal components that capture the maximum variance. It’s commonly used in fields like facial recognition or financial analysis to reduce the number of variables while retaining the most important information.
- t-SNE (t-Distributed Stochastic Neighbor Embedding): t-SNE is particularly useful for visualizing high-dimensional data in 2D or 3D spaces. It’s often used in image analysis and genomics, helping researchers to identify clusters and patterns within complex biological data.
By reducing the complexity of your dataset, dimensionality reduction makes it easier to interpret the most critical features, allowing for deeper insights and faster decision-making.
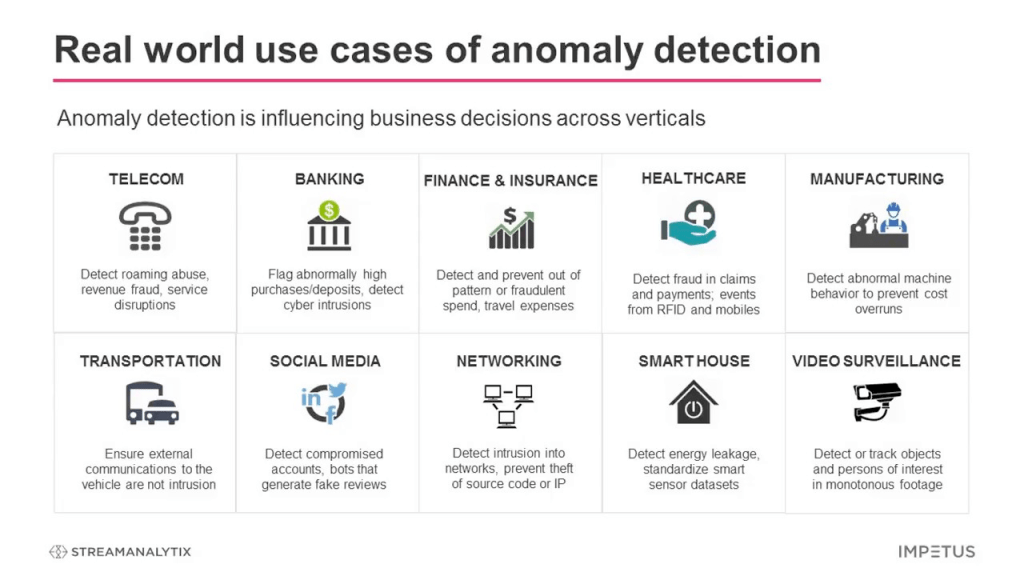
Anomaly Detection: Finding the Hidden Gems
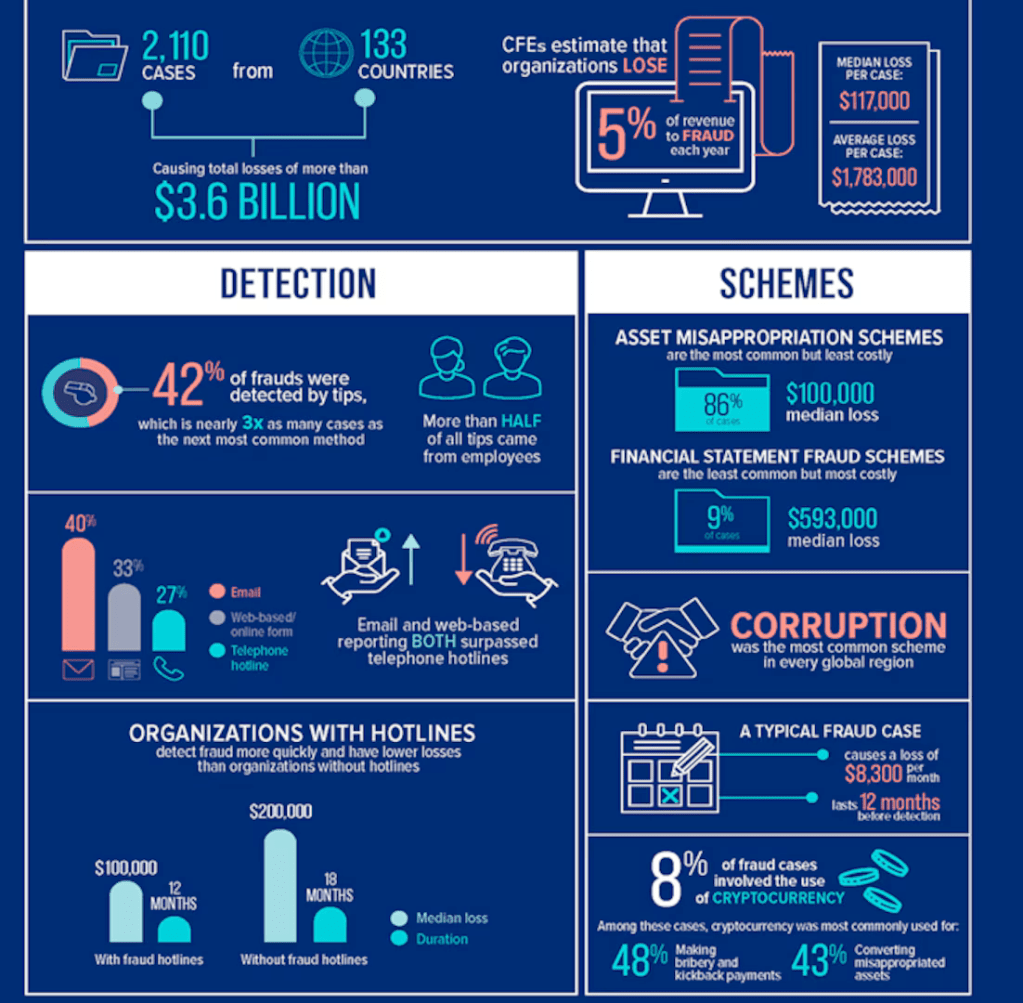
Anomaly detection is like finding a rare, first-edition book in your library—it helps identify data points that deviate significantly from the norm. Whether it’s spotting a fraudulent credit card transaction or identifying defective products in manufacturing, anomaly detection is a powerful tool in recognizing rare or unusual events.
Key methods of anomaly detection include:
- Isolation Forest: This algorithm isolates anomalies by recursively partitioning the data, making it easier to separate rare data points from the norm. It’s highly effective for fraud detection and network security, where detecting unusual behavior is critical.
- One-Class SVM: A specialized form of Support Vector Machine, One-Class SVM is designed to distinguish normal data points from outliers, making it useful for cases where the goal is to identify unusual activity, such as network intrusion detection.
- Autoencoders: Autoencoders are neural networks used for anomaly detection in complex datasets like images or video streams. They work by learning to compress data and then reconstruct it, with anomalies showing up as points where reconstruction fails significantly—such as detecting suspicious activity in surveillance footage.
Anomaly detection ensures that no hidden gem—or potential risk—goes unnoticed within your data.
Real-World Applications of Unsupervised Learning
The real power of unsupervised learning lies in its broad applicability across industries. Some examples of how it’s used include:
- Customer Segmentation: Businesses can use clustering algorithms to segment customers based on behavior, demographics, or purchasing habits, creating more targeted marketing strategies.
- Image and Video Analysis: Clustering and dimensionality reduction techniques are commonly applied in image processing, such as in object detection or image segmentation, without needing labeled data.
- Fraud Detection: Financial institutions leverage anomaly detection to identify unusual patterns in transaction data, preventing fraud before it happens.
- Recommendation Systems: Unsupervised learning algorithms help build recommendation engines by grouping users based on shared preferences, allowing companies to suggest personalized content or products.
These examples highlight the versatility of unsupervised learning in solving complex, real-world challenges.
Unsupervised learning offers a way to explore and discover hidden patterns and structures within your data, much like venturing into uncharted territory without a map. From clustering algorithms to dimensionality reduction and anomaly detection, these techniques provide the means to unlock insights and find value where none was obvious before.
So, grab your magnifying glass and start delving into your data. You can bet you will uncover hidden gems that reshape your business or industry.

Leave a comment