

I’ve always been fascinated by the challenge of predicting future stock prices. None of us has the prophetic powers to do this despite even fans of Nostradamus, who was thought to be a seer and predictor of the future. However, what can get us close to predicting the future is data. Like many data enthusiasts, I’ve spent time exploring machine learning models on platforms like Google Cloud to analyze stock data and find patterns. What I’ve realized is that behind every prediction—whether it’s stock market trends or weather forecasts—lies the powerful tool of time series analysis. This statistical technique allows us to transform raw data from the past into meaningful insights about the future. Whether it’s finance, healthcare, or environmental science, time series analysis helps us uncover trends, identify patterns, and forecast what comes next.
Understanding Time Series Data
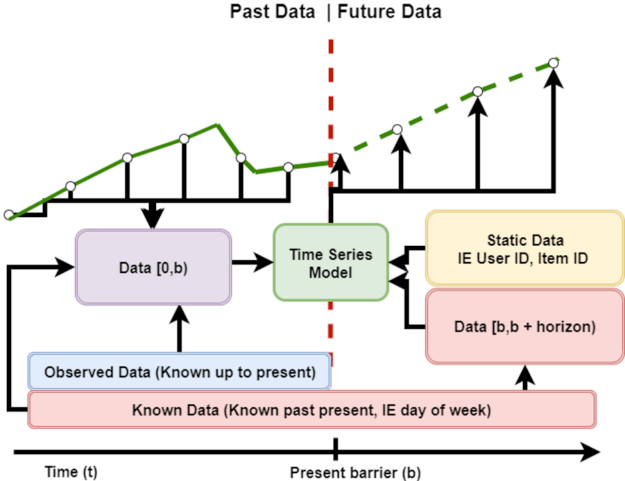
Time series data is a sequence of observations collected at regular intervals—daily, weekly, monthly, or annually. This type of data is common across industries, from finance and economics to healthcare and environmental science. Examples include stock prices, sales figures, temperature readings, energy demand, and patient health data. The unique feature of time series data is its temporal nature—each observation is linked to a specific point in time, allowing us to analyze how values evolve and interact over time.
In practical terms, time series analysis enables organizations to answer crucial questions like: Will stock prices rise or fall next month? How will energy consumption change next season? Can we predict disease outbreaks in the coming year?
Key Techniques in Time Series Analysis
Time series analysis involves a range of techniques that help identify patterns, trends, and seasonality within the data. These techniques make it possible to forecast future outcomes, improve decision-making, and gain insights into what drives the underlying data.
1. Decomposition
Decomposition breaks a time series into its core components: trend, seasonality, and residual noise. The trend shows the long-term direction, seasonality captures recurring patterns (like spikes in demand during holiday seasons), and noise represents random fluctuations.
- Example: In retail, decomposition helps businesses understand seasonal demand, such as increased sales during Black Friday or holiday periods, separating these predictable patterns from random market fluctuations.
2. Smoothing
Smoothing helps reduce variability in the data to reveal underlying trends. By averaging out short-term fluctuations, smoothing techniques allow us to focus on long-term patterns.
- Example: In stock market analysis, smoothing techniques can identify long-term trends in stock prices, filtering out the noise from daily volatility.
3. Autocorrelation
Autocorrelation measures the correlation between values at different points in time. It helps us understand whether past values influence future ones.
- Example: In energy consumption, autocorrelation would reveal that demand at a particular time is influenced by demand from the previous day or week, which can help utilities plan resource allocation.
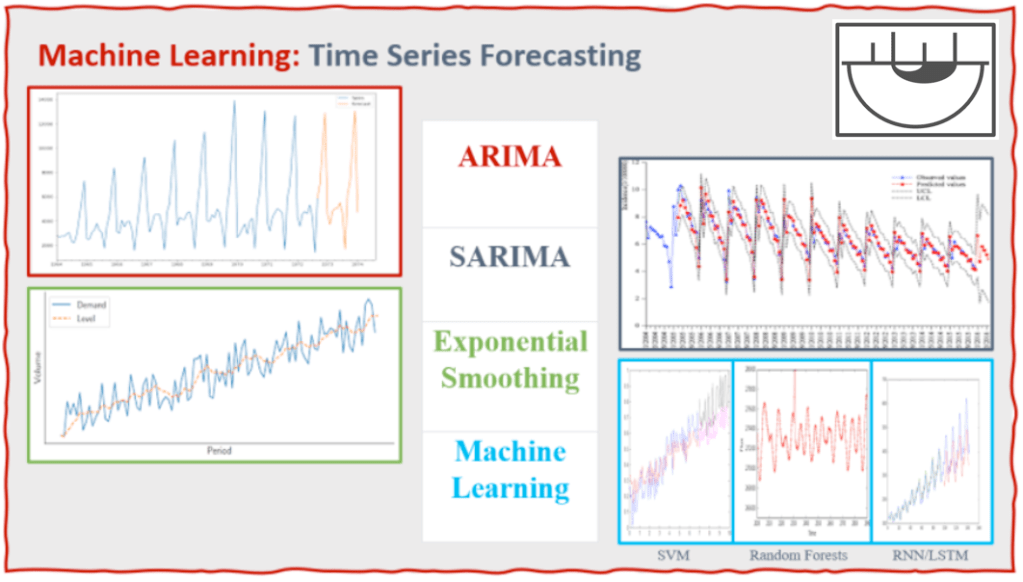
4. ARIMA Models
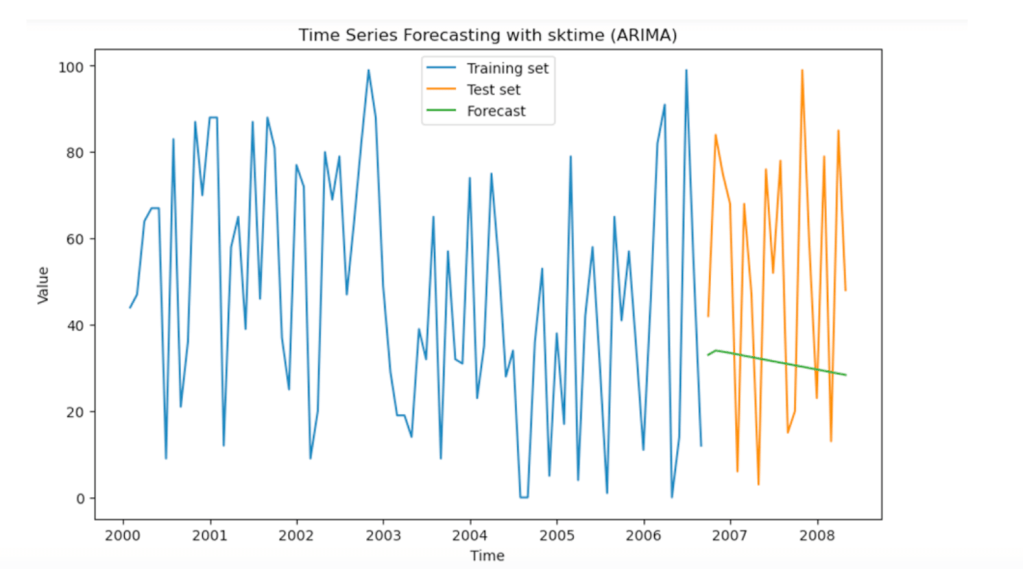
ARIMA (Autoregressive Integrated Moving Average) models are widely used for time series forecasting. These models capture trends, seasonality, and correlations in the data, making them particularly effective for short-term forecasting.
- Example: Economists use ARIMA models to forecast GDP growth, inflation rates, and other key financial indicators.
5. Exponential Smoothing
This family of forecasting techniques assigns exponentially decreasing weights to older observations. It is especially useful when recent data points are more relevant for future predictions.
- Example: Exponential smoothing can be used in inventory management to forecast future product demand based on recent sales trends, helping businesses optimize stock levels.
Real-World Applications of Time Series Analysis
Time series analysis has become an essential tool across various industries. Its predictive power helps businesses, governments, and organizations make informed decisions based on past and present trends. Here are a few real-world applications:
1. Finance
Time series analysis is crucial in predicting stock prices, analyzing economic indicators, and forecasting sales. Financial analysts use it to assess market behavior, identify trends in economic cycles, and make investment decisions.
- Example: Financial institutions use ARIMA models to forecast stock movements or project future earnings based on historical financial data.
2. Healthcare
In healthcare, time series analysis is used to predict disease outbreaks, forecast patient outcomes, and optimize resource allocation. By analyzing patient data, hospitals can anticipate demand for healthcare services, helping them allocate staff and resources more efficiently.
- Example: During the COVID-19 pandemic, time series analysis helped hospitals predict surges in cases and prepare accordingly.
3. Energy
Time series forecasting allows energy companies to predict energy demand and optimize production schedules. By analyzing historical data on energy consumption, companies can forecast peak usage periods and allocate resources accordingly.
- Example: Utility companies use time series models to forecast electricity demand and ensure that power generation meets peak consumption levels during high-demand seasons like summer and winter.
4. Environmental Science
Time series analysis is crucial in climate science, where it is used to monitor long-term climate trends, predict natural disasters, and track environmental changes.
- Example: Meteorologists use time series data to forecast weather patterns and predict extreme events like hurricanes or floods based on historical climate data.
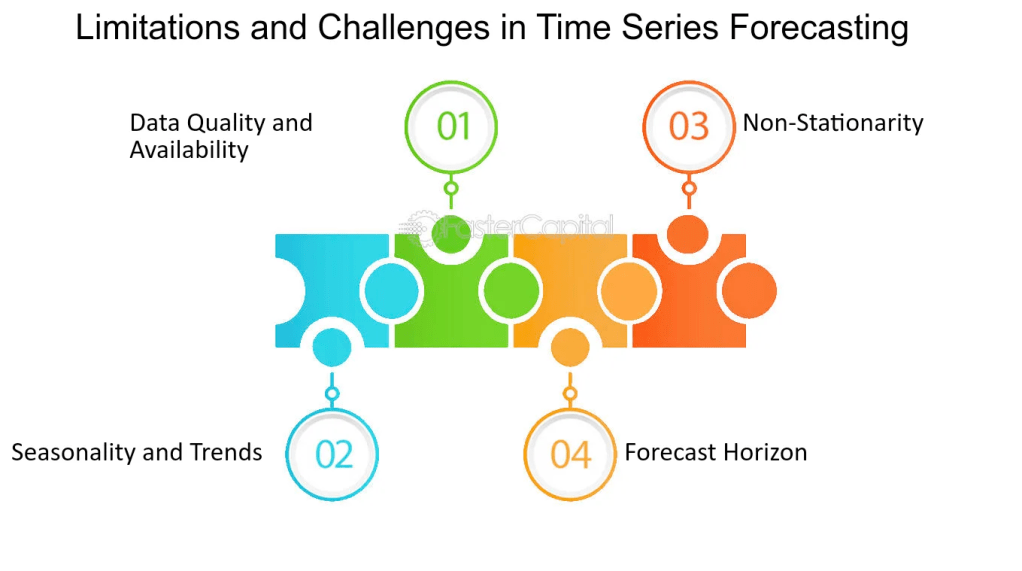
Challenges and Future Directions
While time series analysis is a powerful tool, it also presents challenges:
1. Stationarity
Many real-world time series data are non-stationary, meaning their statistical properties (like mean and variance) change over time. Non-stationarity can make it difficult to model and forecast accurately.
- Solution: Techniques like differencing and seasonal adjustments are often used to transform non-stationary data into a stationary form, making it easier to work with.
2. Outliers
Outliers—extreme values that deviate significantly from the rest of the data—can skew forecasts and lead to inaccurate predictions. In industries like finance, these outliers would represent critical, anomalous events (like market crashes or disease outbreaks).
- Solution: Robust models that can handle or adjust for outliers improve forecast accuracy.
3. Seasonality and Trend
Modeling seasonal patterns and long-term trends can be complex, especially when seasonality fluctuates over time (e.g., climate change causing erratic weather patterns).
- Solution: Advanced forecasting models, such as Seasonal ARIMA and exponential smoothing with trend adjustments, can help tackle these complexities.
Personal Experience: I’ve encountered many of these challenges in my own projects while analyzing stock data. One of the most difficult aspects was dealing with outliers—those days when unexpected news events would send markets into a frenzy. Time series analysis allowed me to smooth out these anomalies and focus on more consistent trends, making predictions more accurate and reliable.
The Future: As technology advances, time series analysis is becoming more sophisticated. Machine learning models, like LSTMs (Long Short-Term Memory networks), are being used to capture more complex patterns in the data. These models are particularly useful for large-scale applications where traditional methods struggle to capture the intricacies of highly variable or noisy data. As we move forward, time series analysis will continue to play a key role in everything from smart cities to climate action plans.
Time series analysis is a powerful tool that enables us to gain insights from the past and make informed predictions about the future. By understanding the techniques and applications of time series analysis, businesses and organizations can stay ahead of the curve—whether predicting stock prices, forecasting energy demand, or anticipating healthcare needs. As machine learning and AI continue to evolve, time series forecasting will only grow more versatile, enabling more accurate and powerful predictions.
Mastering time series analysis isn’t just about understanding the past—it’s about predicting what comes next.

Leave a comment